
An option chain is essentially a comprehensive listing of all option contracts for a particular underlying instrument - be it NIFTY, BANK NIFTY, or an individual stock like Reliance. The chain displays information about call and put options. It provides a snapshot of different strikes as well as other expiry dates, along with the important metrics. These metrics include the premium price, open interest, and implied volatility.
For traders in India, the NSE option chain is the most commonly used resource. It serves as a quick guide to understand the market sentiment, liquidity, and the likely zones of support and resistance, making it a very crucial tool for decision-making.
A basic option chain presents only limited data, such as the strike levels, premium prices, and trade volume. While this provides surface-level insights, it might not be enough for designing advanced strategies.
On the other hand, an advanced option chain offers a more detailed view, including:
These advanced features enable traders to move beyond just observing numbers and instead interpret the market psychology to create structured trading strategies.
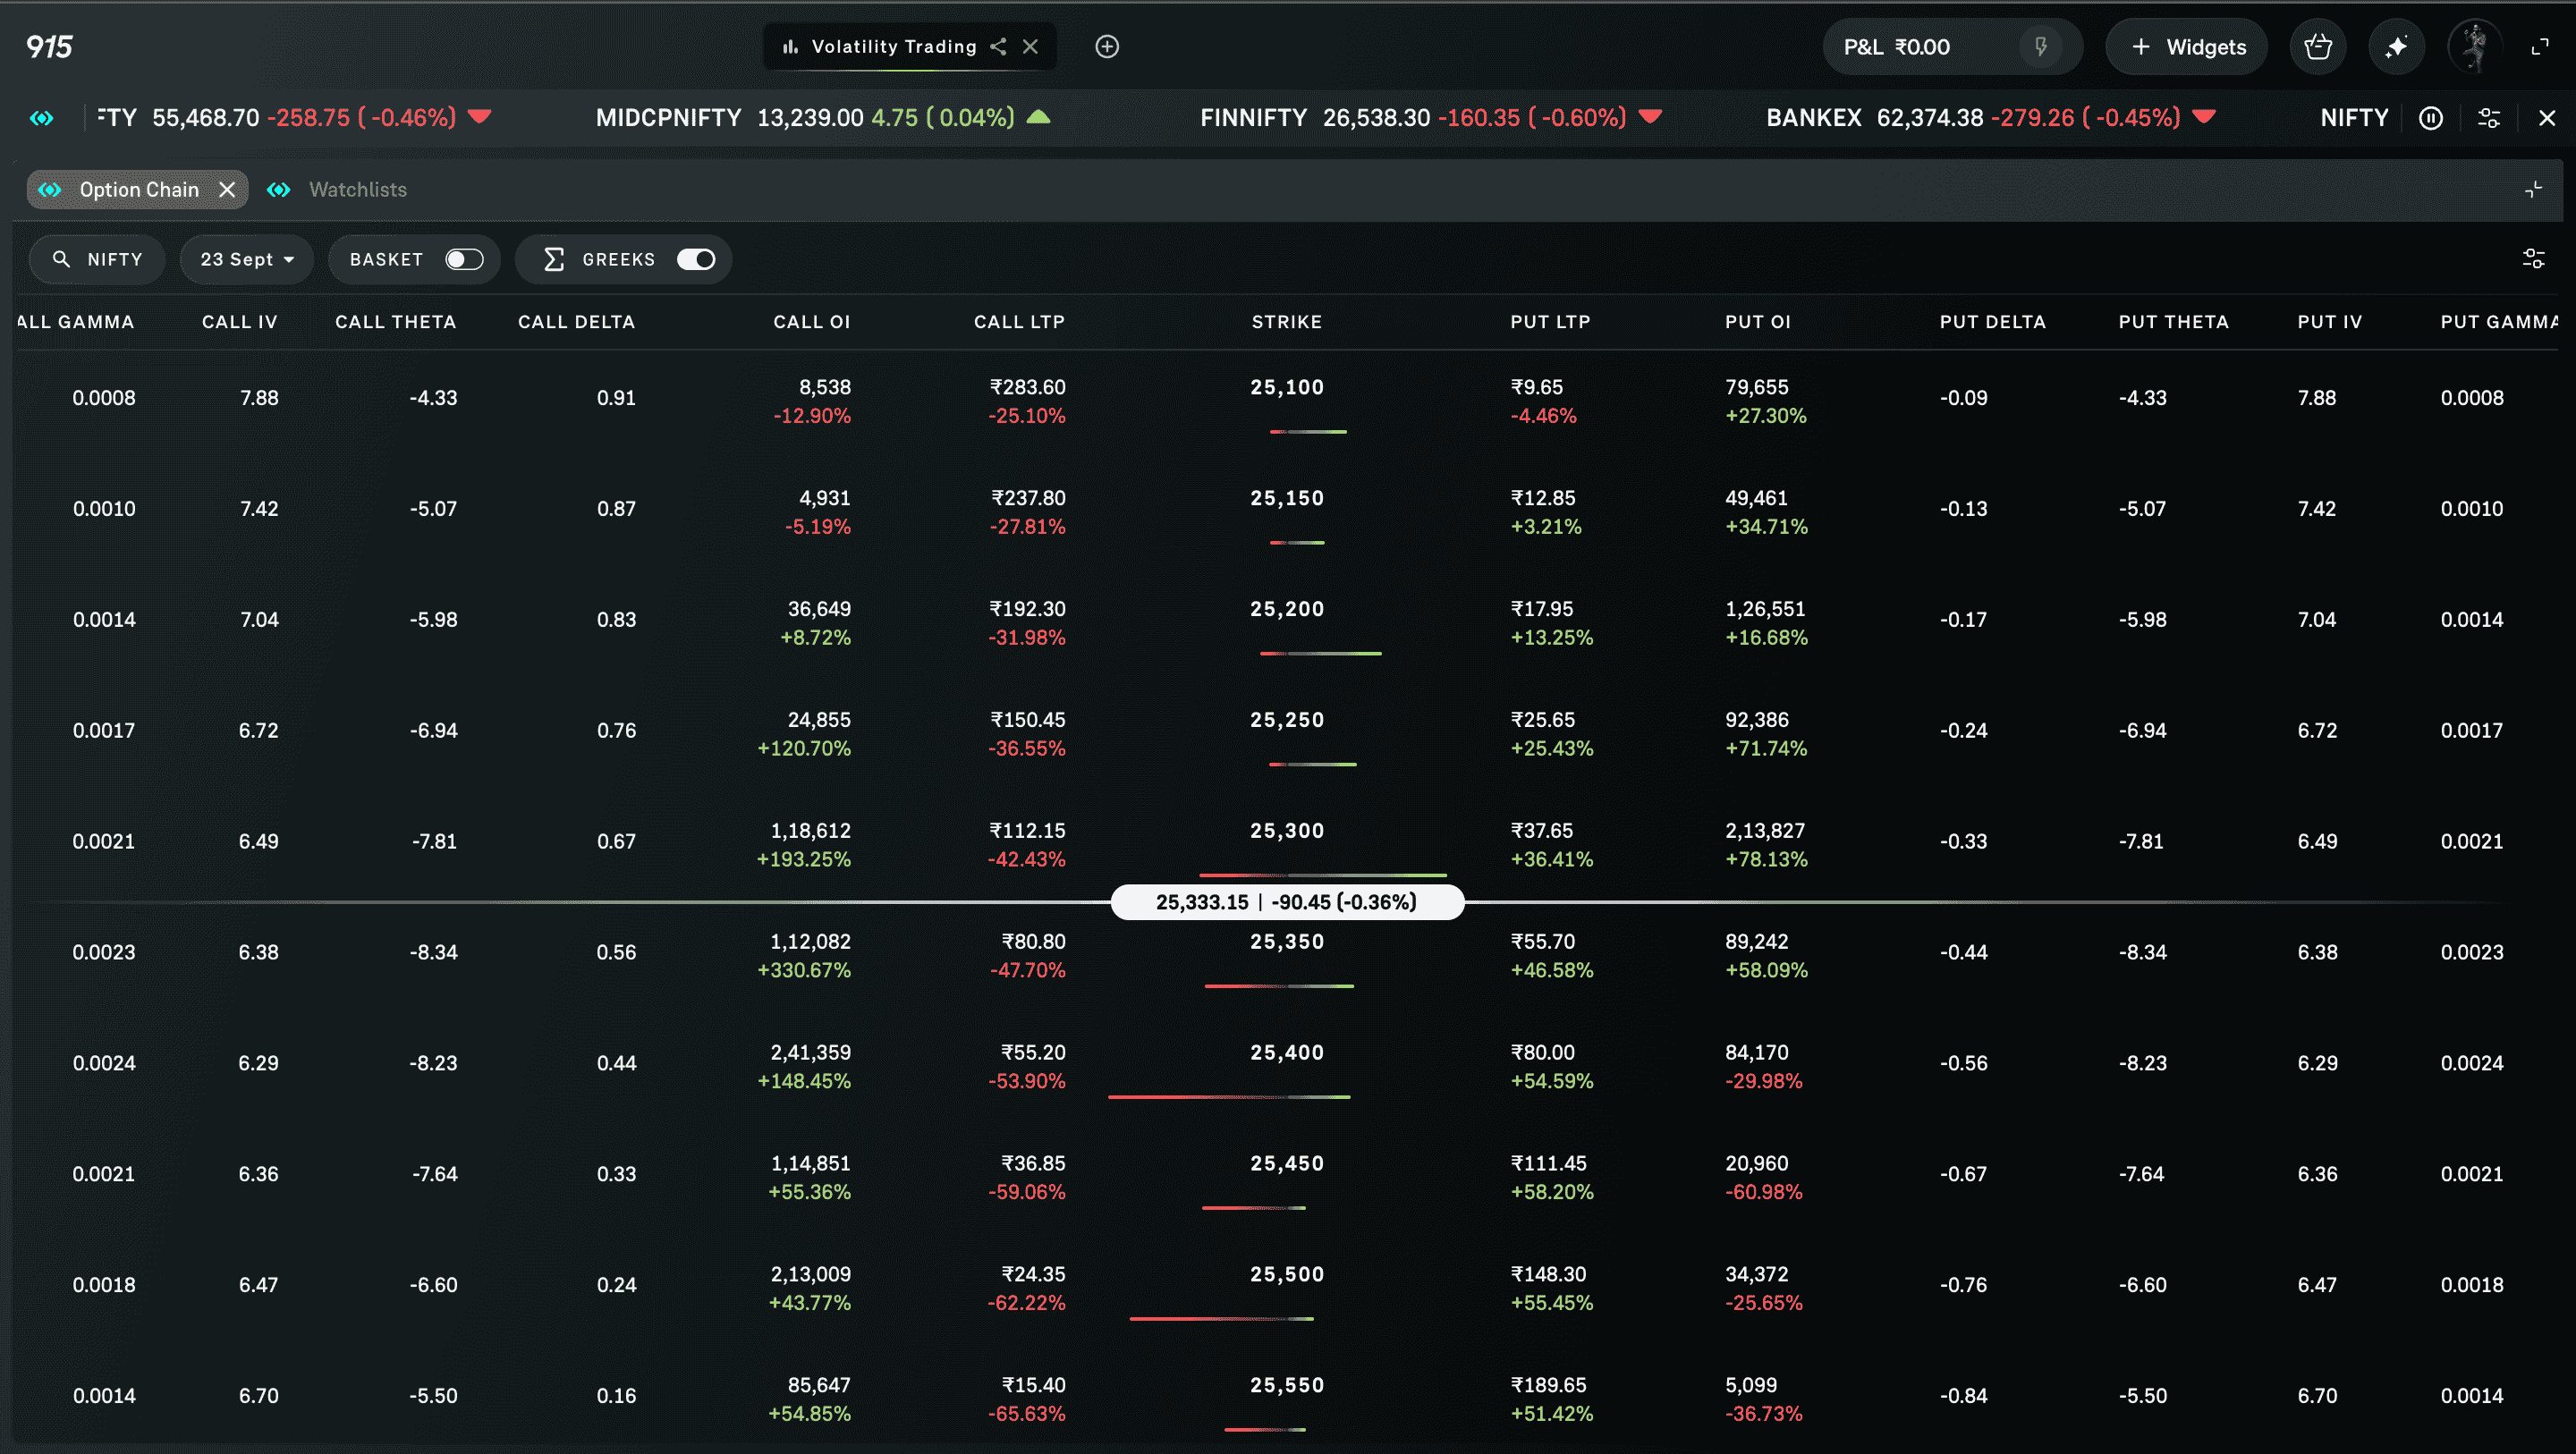
A robust option chain includes several layers of information. The most important components are:
Interpreting an advanced Option chain requires a systematic approach. Some of the key techniques include:
Checking OI buildup: Call Strikes, where there is high OI, generally act as a resistance. On the other hand, the put strike, which has the highest OI, can indicate support. For example, if NIFTY's highest call OI is at 22,500 and the highest put OI is at 22,000, the expected range is 22,000 to 22,500.
Change in OI with price change: By analysing the price and open interest together, traders can interpret the market's behaviour through four key scenarios -
Together, these signals will lead traders to decode the market potential and the sentiment, which can help in trading wisely. Here is the summary:
|
Price Movement |
Open Interest Movement |
Interpretation |
Meaning |
|
Price goes up |
Open interest goes up |
Long Buildup |
Fresh long positions are created; this indicates bullish sentiment. |
|
Price goes down |
Open interest goes up |
Short Buildup |
Fresh short positions are created; this indicates bearish sentiment. |
|
Price goes up |
Open interest goes down |
Short Covering |
Traders are closing short positions, which gives a temporary bullish signal. |
|
Price goes down |
Open interest goes down |
Long Unwinding |
Traders are closing long positions, which gives a temporary bearish signal. |
Look at PCR: To calculate the PCR, divide the total put OI by the total call OI. Here is the summary of how to interpret the PCR:
|
Put-Call Ratio Level |
Interpretation |
Market Sentiment / Meaning |
|
Very Low (below 0.7) |
Calls are more |
This can indicate an overbought market and a possible reversal on the upside |
|
Around 1.0 |
Balanced (Neutral zone) |
Calls and Puts are fairly matched; this indicates a normal, steady market sentiment. |
|
Moderately High (1.0 – 1.3) |
More Puts than Calls |
Traders are hedging or turning cautious, which can indicate mild bearishness. |
|
High (above 1.3) |
Puts are more |
This can indicate an oversold market and downside move. |
Overlay Greeks: Advanced traders may use the delta neutral, theta positive, or volatility-focused strategies after studying Greeks.
There are multiple platforms that provide advanced option chain data. Some of them are -
Advanced option chains are not just observation. They can be actively used in strategy building. Some of the key applications will include:
It is based on OI concentration. Usually, the Call Strike with the highest OI works as a very strong resistance, while the Put Strike with the highest OI works as a very strong support. Hence, OI can help in finding the range of the day.
On the other hand, max pain is used to find the exact level or zone where the index might expire. Max pain is usually the strike at which the index has a high probability of expiring on the expiry day.
Volatility Trading
Traders can use IV spikes around the corporate results, budget announcements, or RBI policy updates to trade events. Since the advanced option chain has the IV data as well, many traders can use it by comparing implied and historical volatility, which can help them set up straddles and strangles.
A very popular scalping strategy in Nifty is done by checking the intraday OI shift. Traders keep monitoring the OI changes throughout the day to come up with scalping strategies.
Here is a strategy in option selling that can be used after identifying support and resistance levels.
At 9:20, we identify the call and put option with the highest OI. For example, 24500 CE and 24000 PE.
The option writers sell 24500 CE and 24000 PE, creating a short strangle. Now, if the OI concentration does not change, then it means that the market is moving sideways, and the trader can get the benefit of theta decay.
However, if the movement is in a single direction, traders can check the change in OI to manage their positions.
For example, if the market moves up, traders can analyse whether the OI is dropping at 24500 CE and rising at 24700 CE. In such cases, traders can roll over their call position by exiting the 24500 CE and taking a fresh short sell position in the 24700 CE.
A similar change in OI is expected on the put side also. The put OI might shift from 24000 to 24300, in which case the traders can shift the put trades as well. If managed well, this can lead to good accuracy.
Expiry day trading can also be done using an advanced option chain. To do this, many traders use max pain, and again, this is an option selling strategy. Usually, the max pain will give the level where NIFTY is expected to expire. So traders can continue to follow the max pain. This can be done using short straddles and short strangles. A similar adjustment is required, as discussed in the previous example.
PCR gives great reversal strategies, especially for option buyers. Extreme conditions can give good reversal moves. So if the PCR is very low (0.6), then traders can expect an explosive upmove and can go for call buying strategies.
On the other hand, if the PCR is very high (1.4), then traders can expect an explosive downmove and can go for put buying strategies.
While an advanced option chain offers significant benefits, it also has some limitations. Here is the summary:
An advanced option chain is much more when you compare it with the price listing-it is a powerful analytical tool. This is for understanding the market. By the combination of open interest, implied volatility, PCR, and the Greeks, traders can move from mere speculation to structured, probability-driven strategies.
For Indian traders, especially those who are dealing with NIFTY and Bank NIFTY, measuring advanced option chains can prove a great advantage. However, like in any kind of trading, the holy grail is always having strong risk and money management.
Frequently Asked Questions
What is the difference between a basic and an advanced option chain?
A basic option chain lists strike prices, premiums, and volume OI only. On the other hand, an advanced chain will add deeper metrics. There might be changes in OI, IV, PCR, Greeks, and visual tools like payoff diagrams and OI charts.
How do I analyse an advanced option chain?
You should identify the OI concentration for support and resistance. Then the study on the change in OI should be made. It helps to track fresh buildups. Traders can also monitor OI for event-driven volatility. PCR can be checked for the market sentiment.
What data points are critical in the advanced Chains?
Some of the important data points in the advanced option chain are
Historical trends in OI/IV: It will provide statistics for the current data to know whether the current option prices are cheap or expensive.
Which platforms will offer an advanced option chain?
These are some platforms that offer advanced option chains, such as the NSE Website, which is free and highly reliable, but has minimal analytics. Broker platforms such as Groww and 915 provide extra tools such as OI charts, IV analysis, and strategy builders.
How can advanced option chains help in trading decisions?
These are some ways in which an option chain can help:
Expiry Day scalping: It is popular in the NIFTY, where the intraday OI shift can reveal opportunities.
Vaishnavi Tech Park, South Tower, 3rd Floor Sarjapur Main Road, Bellandur Bengaluru – 560103, Karnataka
© 2025 915.trade by Groww. All rights reserved.