
The Descending Triangle is considered to be one of the most powerful bearish patterns. The pattern is relatively common, and traders often encounter this in multiple stock markets. The pattern consists of a bottom horizontal support line along with a descending resistance line at the top.
The Descending Triangle pattern captures the battle which happens between the buyers and the sellers. Buyers try to hold their ground. However, the sellers can overpower them gradually. This eventually leads to a strong bearish movement. The pattern is viewed as a continuation pattern. A prior downtrend is essential for this pattern to work.
Here is how the Descending Triangle pattern looks-
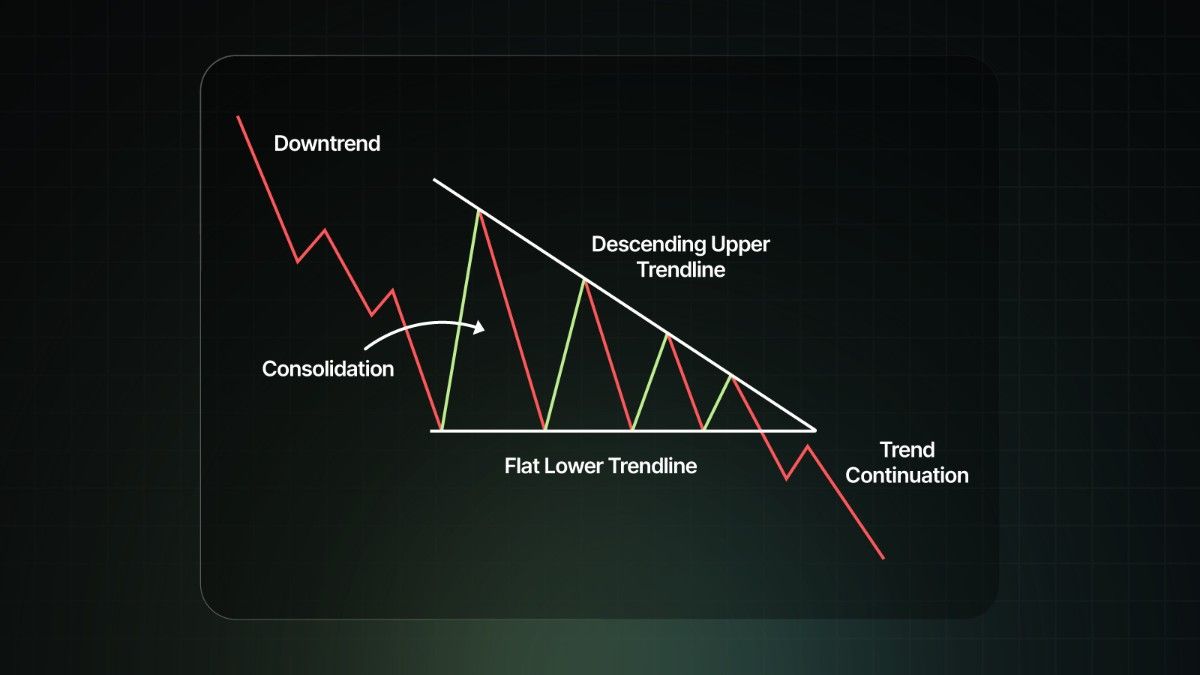
The descending triangle pattern has two parts:
Over time, these two forces may squeeze the price into a narrowing range. This depends on the time frame; the triangle may last from a few weeks to several months.
In shorter time frames, it might compress quickly. The best way to think of this is spring being compressed. As the pattern continues to grow, the tension builds up. Eventually, the spring releases its energy. This is usually in the direction where there is less resistance. And in the case of Descending Triangle, this is the downward short entry.
The Descending Triangle pattern gives a sign of deep market psychology. Buyers are trying to take the market up from the support level. However, they are unable to push the prices up. Every rally attempt is weaker than the previous one. Sellers, on the other hand, are trying to lower prices. They are consistently able to do, as can be seen by declining swing highs. Every time the sellers hit the support zone, it weakens.
Let's take an analogy. Imagine a person who is hitting the ground with a hammer. The first few hits are usually a waste of effort. There will be evidence of very little to no damage. However, if he keeps striking multiple times, these blows will eventually lead to a crack. Similarly, the more often the price tests the support, the higher the probability that it will break down decisively. This is the reason why the descending triangles are classified as a bearish continuation pattern.
Here is how a descending triangle pattern can be traded:
If the market reverses unexpectedly, you are protected from significant losses.
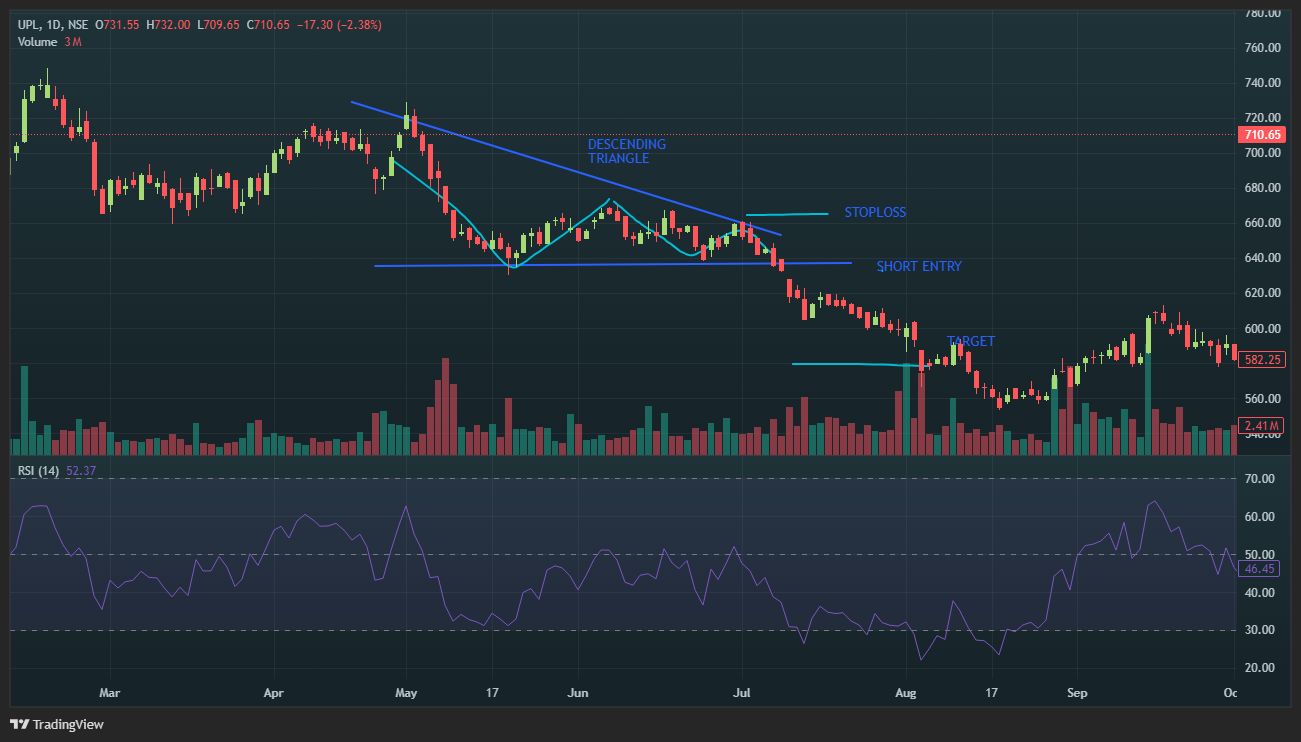
Here is an example of UPL on a daily timeframe. A descending triangle formation occurs, which breaks the support level. Traders can get a short entry there. The stop loss can be the previous swing high. Traders may put a 1:2 target on the downside, which can be easily attained in this case.
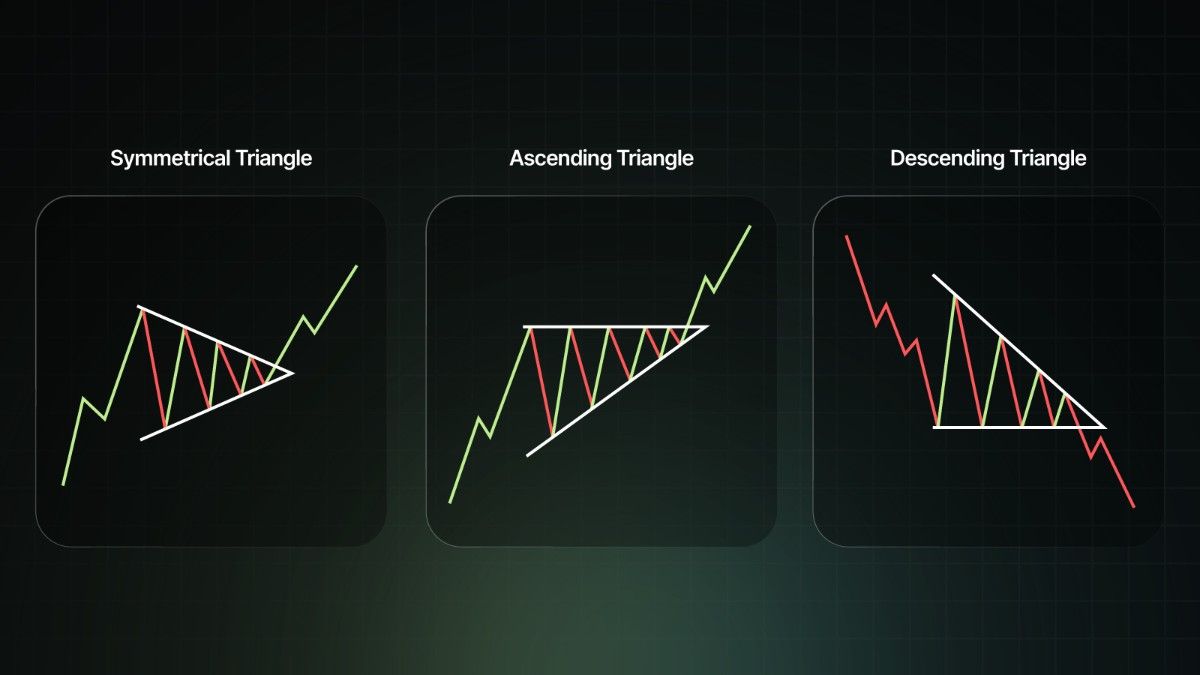
There are different kinds of triangle patterns. Here are the differences between them:
Here is the anatomy of the three types of triangles:
While this pattern more often than not produces good short entries, it cannot always be profitable. Risk management is extremely important when you are trading the pattern. Traders should put a stop loss and aim for a risk-to-reward ratio of at least 1:2. If the markets are choppy, traders can reduce the position size because the accuracy of the pattern reduces.
The descending triangle is one of the most useful bearish patterns. It can be used to convey that there is growing seller pressure, weakening buying strength and a high probability of breakdown. To be able to trade successfully, traders must:
When used with the correct mindset and discipline, it could help the traders identify the high probability setups.
Frequently Asked Questions
What does a descending triangle pattern mean?
The descending triangle is considered to be one of the most powerful bearish patterns. It helps traders to get good short entries.
Is the descending triangle pattern bearish?
Yes, the descending triangle pattern is mainly used to take bearish entries.
How to confirm a breakdown?
Some of the ways to confirm a breakdown are ensuring that there is strong volume, the candle closes below the resistance or taking the retest entry.
What is an ideal volume profile?
Volumes are usually high during the breakdown. Low-volume breaks will often be a trap.
Can the descending triangle pattern act bullish?
While the descending triangle pattern can act as a bullish pattern, it is very rare. Traders generally trade it in a bearish trade.
Vaishnavi Tech Park, South Tower, 3rd Floor Sarjapur Main Road, Bellandur Bengaluru – 560103, Karnataka
© 2025 915.trade by Groww. All rights reserved.