
In technical analysis, traders use multiple patterns to find the quick reversal entry. Double Bottom is one such pattern which is known for giving good bullish reversal formations. The pattern is usually very reliable when it comes after a prolonged downtrend.
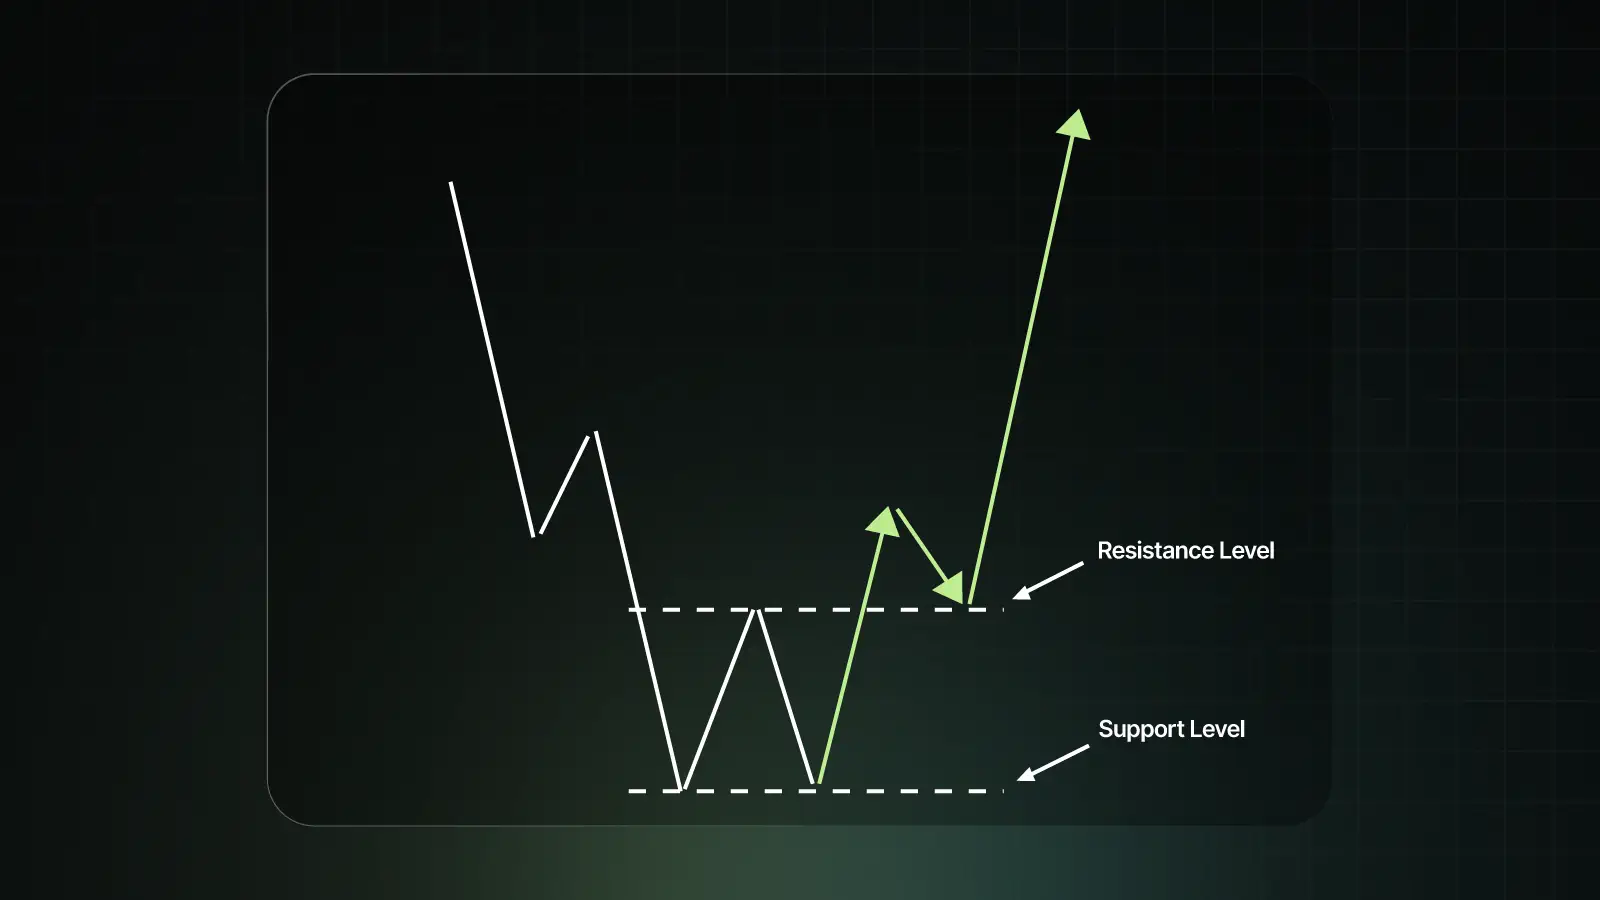
The main signal of the Double Bottom pattern is the drop in selling pressure, paving the way for a potential uptrend. The Double Bottom pattern resembles the English alphabet "W," where the price tests the same support level twice before bouncing upward.
The pattern has been observed in various National Stock Exchange (NSE) and Bombay Stock Exchange (BSE) stocks, as well as top indices such as NIFTY50, Sensex, and BANKNIFTY. Even commodities on the Multi Commodity Exchange (MCX) often exhibit double bottom patterns before major reversals. Therefore, understanding this pattern can help capture good bullish reversals.
This is how a Double Bottom pattern looks -
A double bottom typically develops in these stages:
Traders should look for key characteristics to identify a valid double bottom:
The Double Bottom pattern exhibits a strong shift in the market psychology. During the first decline, at the first bottom, there is a clear dominance of sellers, which pushes the prices down. Then there is a temporary rebound when the buyers step in, but the rally is weak as bears are still in control.
Then the second decline occurs as the sellers try again but fail to push prices below the earlier low. This indicates selling exhaustion. Finally, the buyers are able to regain confidence and overpower sellers, leading to a trend reversal.
There are multiple ways to trade the double bottom. The entry can be done in 3 ways:
Method 1: This is a very aggressive method in which the buying entry is taken as soon as the stock makes a double bottom. This is extremely risky because the stock can continue its downfall, which may end up hitting the stop loss very easily.
Method 2: This is the usual buying entry when the stock breaks the resistance neckline. Most of the traders use this method because it is a more conventional way to trade a double bottom pattern.
Method 3: The third and most rewarding entry is the retest entry. Many times, the stock comes back to the neckline after the breakout. It touches the neckline (which is now the support level) and continues the move upwards. This method offers the best risk-to-reward considering the risk taken.
The targets and risks vary depending on the chosen entry method.
Method 1: In the case of method 1, the stop loss is the low of the candle, which makes the double bottom. There is a high chance of this getting hit. The target is the neckline, and hence, there is a high-risk and high-reward trade. The risk-to-reward ratio in this case can be around 1:5
Method 2: In this case, the stop loss is the support level (where both the bottoms have been made). The target is much more conventional here at 1:1 or 1:2. The accuracy of this method is higher than the first method.
Method 3: Many traders favour this entry. The stop loss is either the neckline or the candle low, which is touched after the retest. The target again can be perfect here at around 1:3. The accuracy of this method is probably the best. However, many times this entry might get skipped if the stock does not do any retest and just breaks out of the neckline zone.
However, before trading this pattern, common risk management tips should be undertaken by the traders, such as:
Traders should be careful about common mistakes, such as:
Let's take an example of a double bottom pattern in SBIN on the daily timeframe -
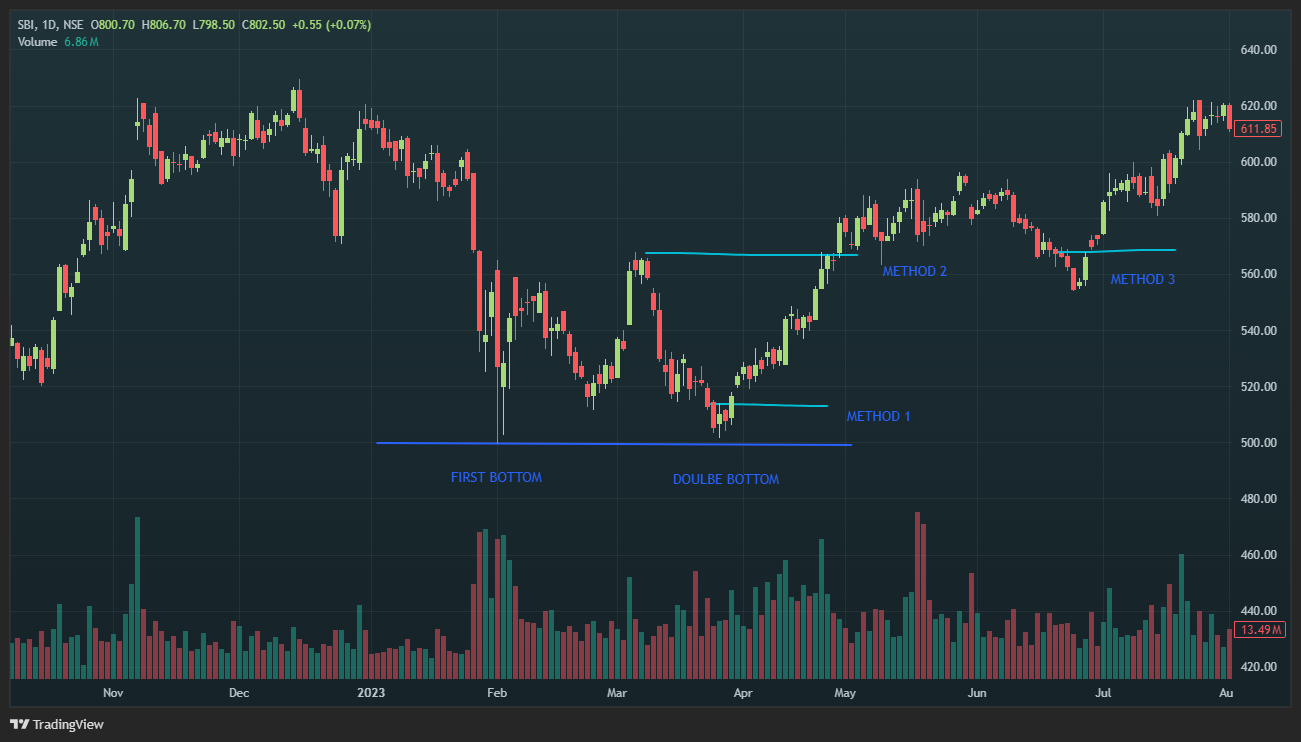
As can be seen from the chart, the SBIN stock was in a downtrend, and then it made the Double Bottom pattern. Now, the traders can opt for any of the three entry methods as described previously. All the methods have been shown on the chart. SBIN made a strong upmove after forming the Double Bottom pattern and would have generated handsome profits using all three methods.
The double bottom is a powerful bullish reversal pattern that can give traders and investors an edge in identifying market turning points. The pattern is more reliable on daily and weekly charts. It works even better with volume confirmation. Traders can also combine it with indicators like RSI, MACD, and support/resistance analysis to increase the probability of success. With practice, the double bottom can become a key part of your trading and investing toolkit.
Frequently Asked Questions
Q1. What is a double bottom pattern?
The Double Bottom pattern is a bullish reversal chart formation that looks like a "W". It signals the end of a downtrend and the start of a possible uptrend.
Q2. How can I confirm it before entry?
There are multiple ways to enter the Double Bottom pattern, such as breakout of the neckline, waiting for a retest of the trendline and taking an aggressive entry as soon as the double bottom pattern occurs.
Q3. What timeframe is ideal for this pattern?
As with most patterns, the daily and weekly charts are most reliable. Intraday charts can give false entries using this pattern.
Q4. How does volume affect this setup?
High volume during the neckline breakout confirms strong buying interest, making the reversal more reliable.
Q5. Is it a reliable reversal signal?
Yes, the double bottom pattern is typically a perfect and reliable reversal pattern. Traders can supplement it by looking at RSI or Supertrend to get more confidence before taking the trade.
Vaishnavi Tech Park, South Tower, 3rd Floor Sarjapur Main Road, Bellandur Bengaluru – 560103, Karnataka
© 2025 915.trade by Groww. All rights reserved.