
Reversal patterns, as the name suggests, are patterns that can help give hints from where the market might be reversing. It signals a potential trend change. There are several different types of reversal patterns observed in the market, including the Double Top, Double Bottom, and Head and Shoulders patterns. These patterns help in identifying trend reversals early. Once the trend reversal is caught at an early stage, it can be used to trade profitably.
A typical double top pattern formation looks like the following -
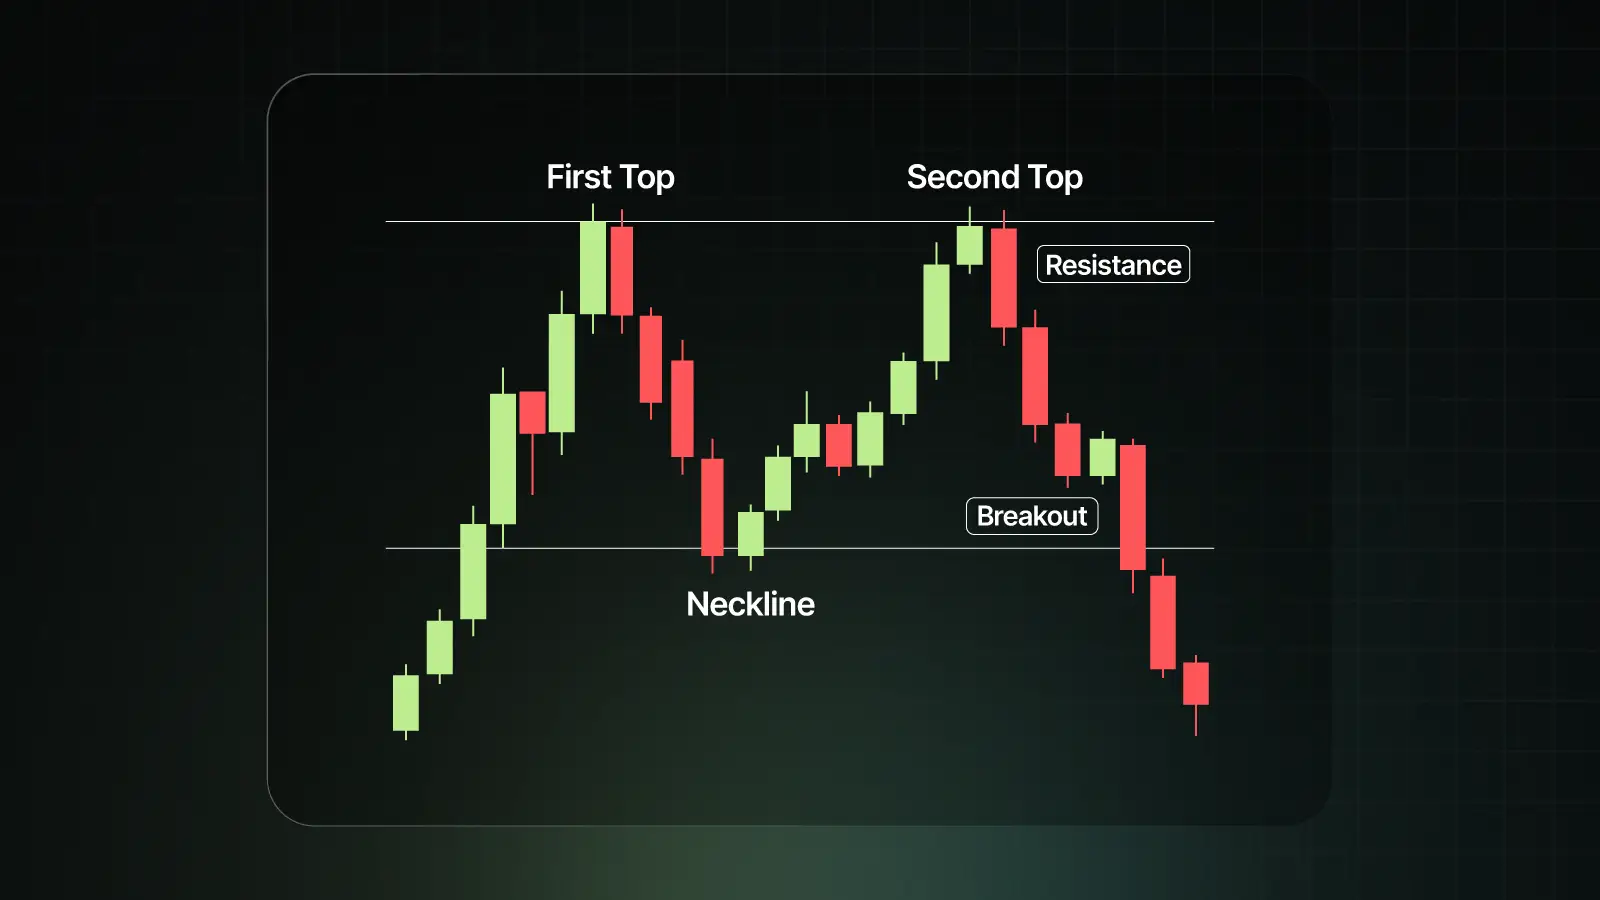
The structure of the pattern has two distinct peaks at nearly the same level. Many times, the height of both peaks is almost at the same level. The pattern usually appears after a sustained uptrend.
After the first peak, there is a pullback, and a neckline is created. This is the support level connecting the lowest point between two peaks.
The second top after the neckline is created at the same level as the first top, and this can be considered a strong resistance.
Technically, the double top pattern starts here. If the market falls and further goes below the neckline, the break below the neckline confirms the reversal and is called a breakout (or breakdown).
The pattern has an interesting market psychology behind it. During an uptrend, the first top is made. This shows that the buyers push the price higher, but face resistance.
Then a normal pullback appears, where there is either profit booking by the buyers or sellers testing control. The price retraces to the neckline.
Then again, the buyers try to move the price up, and the second top is made. This is critical. The buyers are unable to break the resistance, and the buying pressure dies at around the same level where the first top was made. This is where strong downward pressure can build up, where sellers dominate, triggering a bearish reversal.
There are a few ways to identify a double top pattern on the chart. Here’s how -
The pattern offers multiple trading strategies.
For aggressive traders, a bearish entry can come near the second top. The entry level can be the low of the candle where the second top is made. And stoploss can be slightly above the second top. The target in this case can be the neckline level. This will usually provide a risk-to-reward ratio of more than 1:3.
For conservative traders, you can wait for a confirmation of the breakdown below the neckline. The bearish trade can be initiated when the neckline level is broken to the downside. The stoploss can be slightly above the second top. The target is usually the height of the pattern (distance from the neckline to the peak) projected downwards.
Here are some common mistakes that can be avoided while trading the double top pattern:
Let us look into some examples of how the double top pattern works:
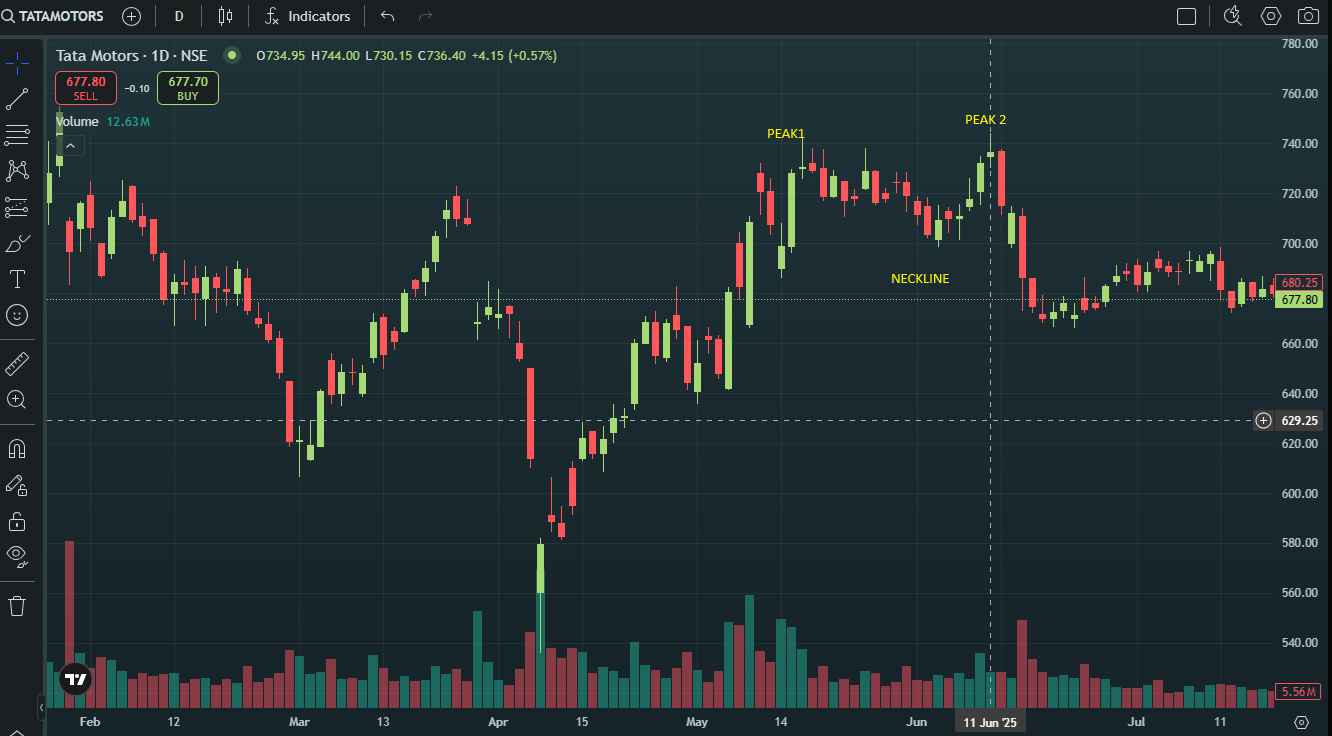
Let us consider an instance of aggressive entry. The above chart shows TATAMOTORS on a daily timeframe. We can clearly see that the stock was in an uptrend. Then there was the formation of a peak followed by the neckline.
Now comes the critical part. There was the formation of peak 2, which was around the same level as 740.
As an aggressive trader, the bearish trade can be taken at the low of the green doji (peak 2 candle). The stop loss can be the high of the green doji candle, and the target can be the neckline level. This gives a risk-to-reward ratio of around 1:3.
On the other hand, conservative traders can wait for the confirmation and take a bearish entry at the low of the neckline. This happens at the big red candle, and there are large volumes as well. Again, the stop loss can be the high of the green doji candle (peak 2), and the target can be 1:1 on the downside.
The target was hit on both trades in this example.
There are other reversal patterns apart from the double top pattern. Here is a comparison between them:
|
Pattern |
Structure |
Trend Context |
Market Psychology |
Confirmation Signal |
|
Double Top |
Two peaks at similar resistance, separated by a dip |
Forms after an uptrend |
Buyers fail twice at resistance, sellers take control |
Breakdown below the neckline with volume |
|
Double Bottom |
Two troughs at similar support, separated by a bounce |
Forms after a downtrend |
Sellers fail twice at support, buyers regain control |
Breakout above the neckline with volume |
|
Head & Shoulders |
Three peaks: a higher middle peak (head) and two lower peaks (shoulders) |
Forms after an uptrend |
Buyers are exhausted after the head, and sellers gradually dominate |
Breakdown below the neckline |
|
Inverse H&S |
Three troughs: lower middle trough and two higher troughs (shoulders) |
Forms after a downtrend |
Sellers are exhausted after the head, and buyers gain strength |
Breakout above the neckline |
Double Top is considered a strong bearish reversal pattern. It works best in trending markets and on higher timeframes. Different types of entries can be deployed using this pattern, and the pattern offers good risk-to-reward to traders. However, traders should combine it with risk management and supporting indicators to make it even more potent.
Frequently Asked Questions
Q1. What does a double top pattern indicate?
A double top pattern signals a potential bearish reversal after an uptrend.
Q2. How to trade a double top breakout?
Conservative traders can use a double top breakout by waiting for the candle to break below the neckline with volume. The traders can then enter a short trade and set a stop above the second top. The target can be at a 1:1 risk-reward level.
Q3. What timeframe is ideal for this pattern?
Daily and weekly charts give stronger signals. Always remember that there can be false trades in intraday charts.
Q4. Can the double top fail?
Yes, if price breaks above the second top, it invalidates the pattern and often triggers a bullish continuation.
Q5. How to distinguish it from consolidation?
In a double top, the price rejects twice at the same resistance with weakening momentum and low volume. On the other hand, if it were a consolidation, then there is usually more random sideways movement without clear peaks.
Vaishnavi Tech Park, South Tower, 3rd Floor Sarjapur Main Road, Bellandur Bengaluru – 560103, Karnataka
© 2025 915.trade by Groww. All rights reserved.