
Volatility is one of the most important forces driving opportunities in the financial markets. It measures the speed and magnitude of price fluctuations. Here is the general understanding of volatility
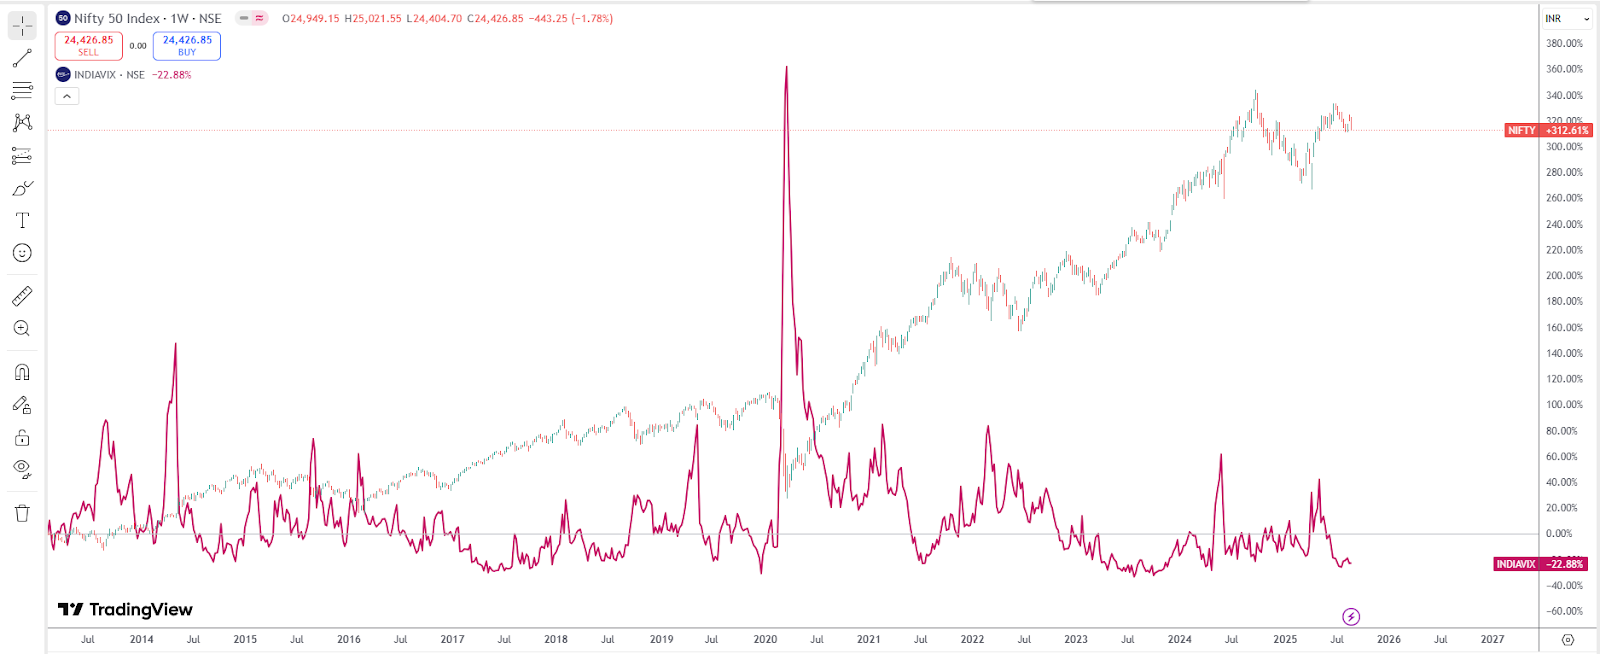
In India, volatility is often tracked using the India VIX, a volatility index which is derived from NIFTY 50 options. For instance, during COVID-19, the market had crashed in 2020, and India's VIX shot over 80. This was the highest VIX level ever recorded, signalling extreme fear in the market.
Similarly, there is a high risk in VIX around Union Budget Announcements or the Lok Sabha elections. This also suggests that traders expect market turbulence. It is important to understand that while Vix is usually opposite to Nifty, this is not always the case, as can be seen from the chart below:
In India, volatility plays an extremely important role due to very frequent macro events (RBI policy announcements, Union Budgets, and elections). Global Fed interest rate decisions or oil price shocks also spill over into Indian markets, driving sudden turbulence. Clearly, understanding volatility is not optional—it's essential for survival in today's markets.
Volatility trading is different from traditional trading. A regular trader usually bets on direction. Whether a stock or index will rise (go long) or fall (go short). But volatility traders don't care about direction. Instead, they care about magnitude. Will the markets move a lot? Or will it stay flat? If the market is expected to move sharply up or down, volatility traders use strategies that benefit from a big move in either direction, while if the market is going to remain quiet, they use strategies that benefit from a lack of volatility. Strategies that may help them profit from the time decay and low volatility.
For example, before the union budget, traders expect NIFTY to move sharply, but they might not know the direction. A volatility trader may buy a straddle (both a call and a put button) to profit either way. On the other hand, volatility is expected to drop after an event such as an election. So, traders may sell options to profit. They wait for the market before initiating the entry. Hence, volatility trading is less about “prediction” and more about the “positioning”.
To succeed in the Indian markets in volatility trading, the volatility must be measured accurately first. Indian traders will use a mixture of measures to measure volatility:
These are based on the nifty options. It reflects the expected volatility expected to be reflected in the next 30 days. Usually, a low VIX (around 18) means the markets are calm, and a high VIX (above 25) indicates nervousness.
It is derived from the option prices. The Black Scholes formula is used to calculate IV. If the IV is high, the options are expensive. It suggests that traders expect a big move. While options are expensive, they also give option buyers the chance of benefiting from quick moves.
It is used to measure past price fluctuations. This is calculated using OHLC of historical data. This measure shows the volatility of a particular scrip over the last 6 months to 1 year.
ATR is a widely used technical indicator for intraday trading. It shows the average daily movement in stocks like HDFC Bank and ICICI Bank.
Together, all these tools will help traders decide whether the options offered are cheap or very expensive.
Here are some popular trading strategies to capture volatility:
In this strategy, traders buy put and call options at the same strike price. They can earn profits from the market if there is a big move in either direction. For example, when buying a NIFTY 22000 straddle before the budget day. And if the market rallies considerably or drops sharply, the long straddle makes a profit.
A “cheaper version” of a long straddle in which you can buy out-of-the-money call and put at different strike prices. It might be cheaper than a straddle but requires a bigger move to profit. Usually, this is more popular in BANKNIFTY since BANKNIFTY is much more volatile than Nifty.
This is a very popular strategy and is usually created ahead of corporate earnings, the RBI policy, or elections. Every company reports quarterly earnings, so event trading is extremely popular, allowing traders to take advantage of IV spikes. Usually, this includes buying a call and put option and exiting just before the earnings are announced.
The opposite also works in event trading. As soon as the results are over, volatility may cool. So, option writers may sell both call and put options to profit. For example, after the Lok Sabha election results, volatility dropped significantly, allowing option sellers to benefit.
In India, volatility trading is almost synonymous with option trading. Options give traders the flexibility to benefit from the movement itself. It rarely depends on the direction. Some ways in which options can be used to capture volatility are given below:
Volatility can be considered a double-edged sword. It may be able to generate the windfall profits. It may also lead to devastating losses. This is a reason why risk management is non-negotiable. Some important points to keep in mind before taking the entry:
These cases may help us understand that, even though volatility is risky, it can be very rewarding.
There are some common pitfalls of volatility trading that traders should avoid:
Volatility is not to be feared. It is to be harnessed and understood. It might offer endless opportunities for all the traders, where you are an option buyer or writer. By understanding volatility, traders can profit from the market even without knowing the direction of the scrip. However, also focus on risk management as that is the key.
Frequently Asked Questions
What does volatility mean in trading?
Volatility means the speed and size of price swings. Low volatility may indicate a stable market. High volatility may lead to large swings. So volatility shows the speed rather than the direction.
What tools can I use to measure the volatility?
Some of the measures of volatility are:
How can I profit from the high volatility?
To profit from high volatility, you can buy the volatility by going for a long straddle strategy before the event. Sell the option after the event when the volatility drops.
Are the options necessary for volatility trading?
Yes, options are directly linked to volatility trading. Different strategies, such as straddle, strangle, etc., are used to capture volatility.
What is Implied vs. Historical Volatility?
Historical Volatility (HV) measures how much a stock’s price has fluctuated in the past, based on actual price movements. Implied Volatility (IV), on the other hand, reflects the market’s expectation of how much the stock might move in the future, which is derived from option prices. In short, HV looks backwards at real data, while IV looks forward at expected movement.
Vaishnavi Tech Park, South Tower, 3rd Floor Sarjapur Main Road, Bellandur Bengaluru – 560103, Karnataka
© 2025 915.trade by Groww. All rights reserved.