The candlestick patterns differ from simple charts, such as line charts or bar charts. A simple line chart only connects closing prices, whereas candlestick patterns give much more information about the market momentum.
Candlestick patterns reveal the market's dynamics, the tug of war between buyers and sellers, and provide traders with a powerful visual representation of market technical analysis.
Whether it is the continuation of the current trend, signs of reversal, or a zone of indecision, by stringing candlesticks together, traders can easily interpret the patterns and gain insight into how the future price will move. By observing the candlestick charts, traders can understand who is controlling the market and whether the bulls or bears have the upper hand.
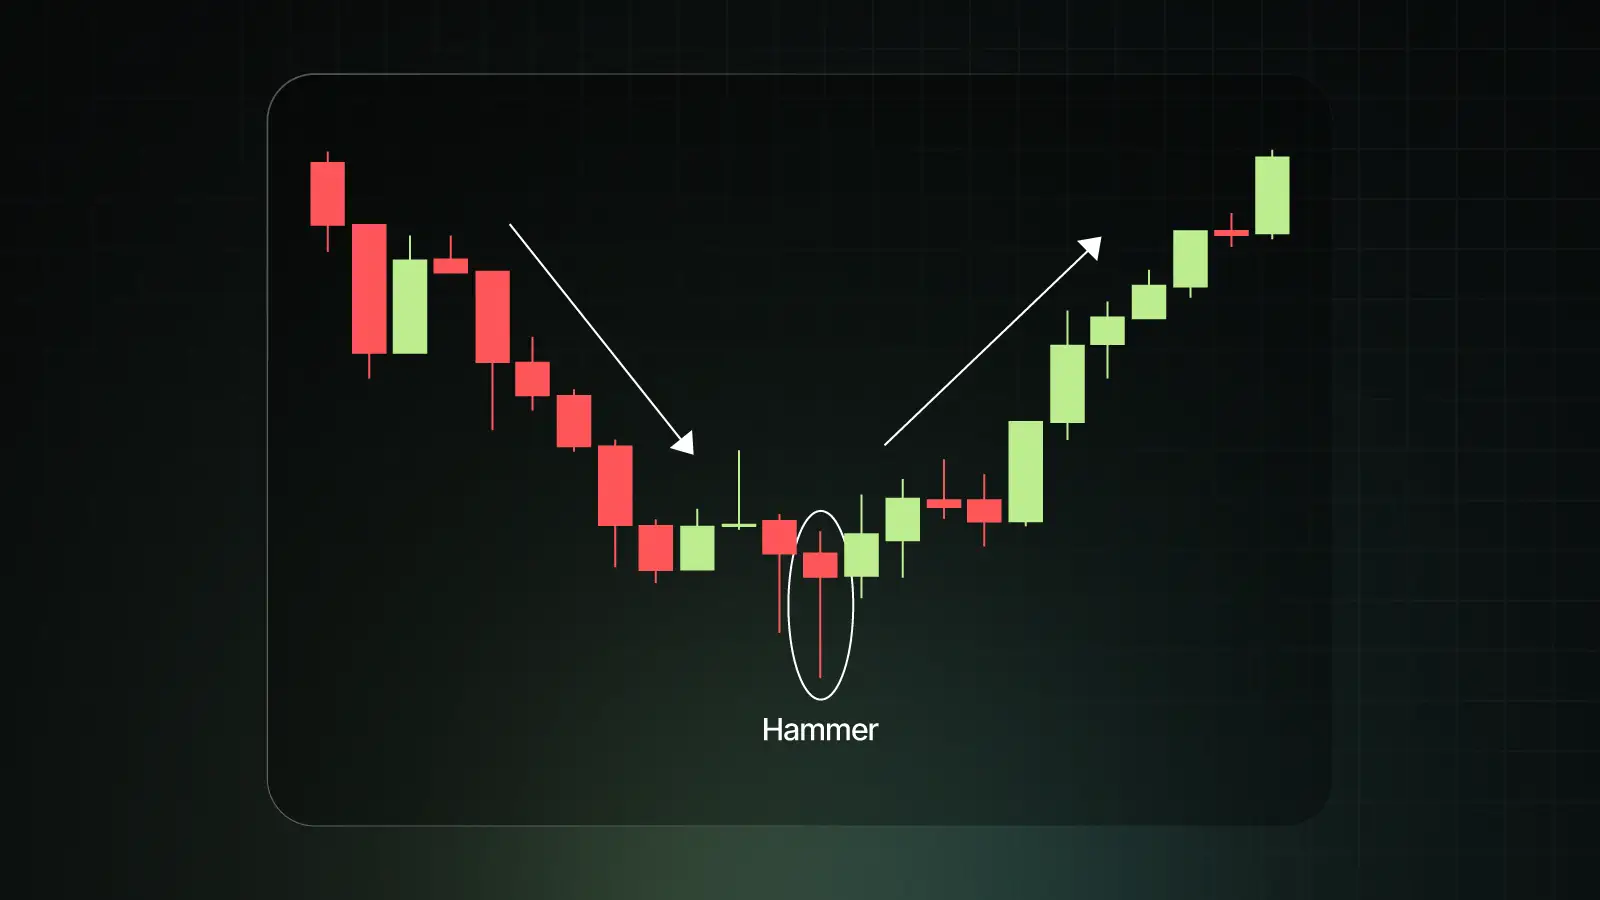
The Hammer pattern stands out as one of the most widely recognised patterns. It is the most trusted single candle reversal signal among the many candlestick patterns studied, as it is particularly powerful at signalling the potential market bottom. The hammer pattern reflects the dramatic shift in the market psychology from sellers to buyers taking charge.
Hammer Candlestick pattern is a single candle bullish reversal pattern. It appears after a decline or prolonged downtrend. It suggests the selling pressure was stronger earlier in the session, pushing the price down sharply, but the buyers stepped in with equal or greater strength to lift the price back up. The importance of the hammer is that it signifies the battle between buyers and sellers, and it marks the potential exhaustion of the downtrend and the subsequent beginning of a bullish reversal. The hammer is significant when it forms after:
Here is what the hammer candle looks like -
A hammer candle has a very distinctive structure that makes it very easy to spot:
What exactly is the psychology behind the hammer pattern to truly appreciate the hammer :
The hammer is so powerful because of its clear shift from bearish to bullish dominance, signalling that the worst of the downtrend is over.
Its importance lies in the following:
While identifying the hammer is straightforward, trading it effectively requires confirmation and discipline.
Ensure the lower shadow is at least 2X the body when you’re looking for a hammer candle, forming a decline.
More credibility is attached to a hammer formed on a volume that is higher than typical. It indicates a lot of purchasing activity.
The long entry can be taken when the high of the hammer is broken. Conservative traders can wait for the candle to close above the hammer candle to take the bullish entry. The traders take a long position at the high of the hammer, giving them early entry, but aggressive traders run a greater risk.
To ensure proper risk management, the stoploss is mandatory. Usually, the stoploss is kept at the low of the hammer candle.
Most of the time, profit targets are based on a risk-to-reward ratio or on nearby resistance levels. Traders can start with a 1:2 risk-to-reward ratio or can place the target at the next resistance zone.
There are some variations of the hammer pattern:
Let's take an example of TITAN on a 15-minute timeframe. This chart is as of August 11, 2025 -
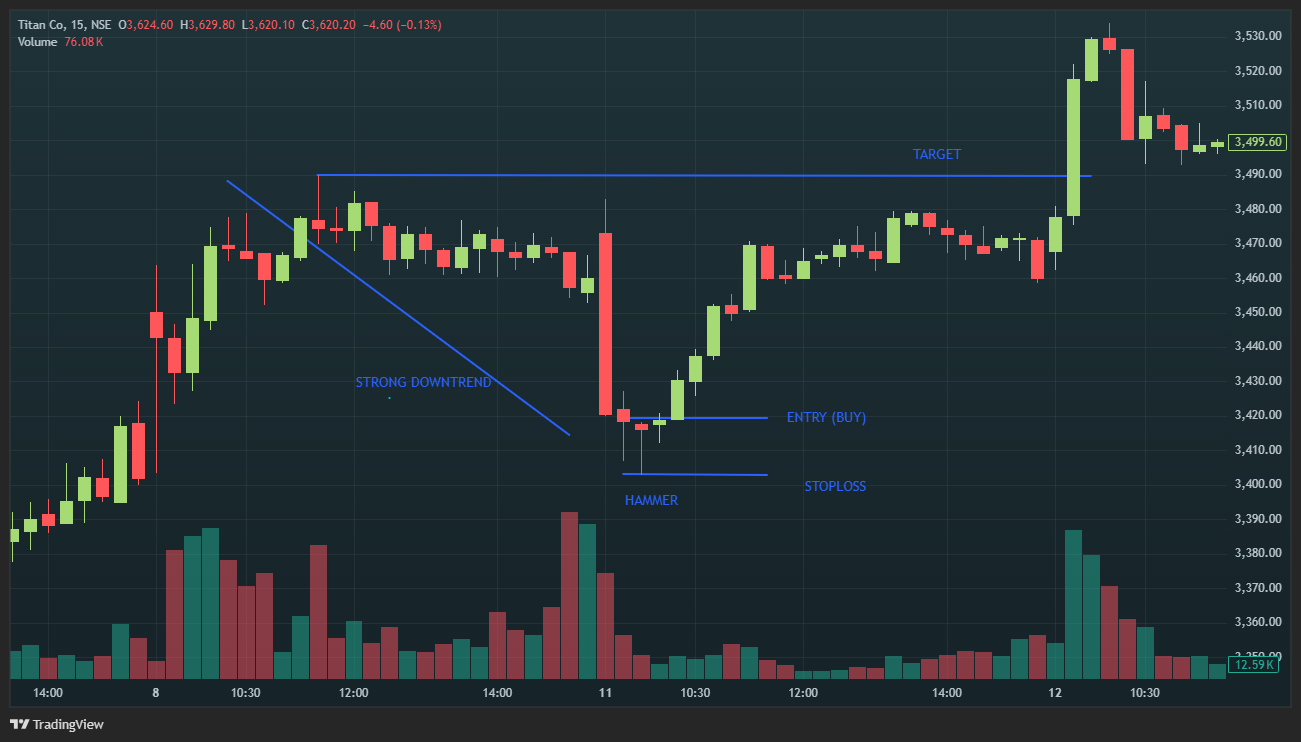
TITAN was in a strong downtrend and made a big red candle. Then we can spot a hammer candle with a small body at the top. Traders can go for a long entry at the high of the hammer candle and keep the low of the candle as the stoploss. The target can be kept as 1:2 or the next closest resistance zone, which has been marked on the chart. The target was easily achieved within the same trading day.
To improve the dependability, traders often combine hammers with other tools:
There can be some mistakes while trading the Hammer Pattern, which traders can avoid:
Hammer can be used with other advanced strategies as well. Some of the advanced strategies that traders implement with the Hammer are mentioned below:
The hammer candlestick is a unique shape which captures a clear shift in market psychology. It illustrates how sellers lose their dominance and how buyers regain control over the market.
The hammer candlestick is one of the most trusted and widely used reversal signals in technical analysis. However, the hammer should not be traded in isolation. Its reliability increases when it forms at a significant support zone, it appears after a clear downtrend and is accompanied by strong volume.
Hammer candlesticks can provide excellent opportunities for disciplined traders. However, like all tools, they are most effective when used in conjunction with risk management, confirmations, and broader technical or fundamental analysis.
Also check: Advanced Option Chain | Ascending Triangle Pattern | Descending Triangle Pattern | Double Bottom Pattern | Double Top Pattern | Evening Star Pattern | Morning Star Pattern
Frequently Asked Questions
Q1. What does a hammer candlestick indicate?
When sellers force prices lower at the end of a downtrend but buyers regain control, it suggests a possible positive reversal. At this point, a hammer candlestick often forms, which is a bullish pattern.
Q2. Is the hammer pattern bullish or bearish?
If the hammer occurs after a decline, it is considered a bullish signal. If the creation of a hammer follows a prior uptrend, it is actually known as a hanging man, which is a bearish pattern.
Q3. How reliable is the hammer pattern?
Alone, it’s moderately reliable. Reliability improves if it forms at major support, with high volume, and with confirmation.
Q4. What timeframe works best for hammer patterns?
Intraday hammers can give false signals due to noise; therefore, daily and weekly charts are more reliable.
Q5. How can I confirm a hammer candlestick signal?
Confirmation can be made if there are multiple confluences from volume, RSI divergence, and the formation of a hammer at essential support zones.
Vaishnavi Tech Park, South Tower, 3rd Floor Sarjapur Main Road, Bellandur Bengaluru – 560103, Karnataka
© 2025 915.trade by Groww. All rights reserved.